Adopted as the core 2026 business goal
The AI Quality Score was adopted as the core 2026 business goal, the headline measure tying together churn reduction, vertical-specific growth, and AI improvement priorities. A senior leader described it as potentially the single most important company metric. I wrote the strategy, defined the scoring criteria, and drove the buy-in that got it there. It started from a problem the business felt every week but could not measure.
My role: I wrote the strategy and defined the scoring criteria, then drove buy-in across the C-suite. Timeframe: roughly eight weeks from first draft to company-wide adoption. Result: adopted as the core 2026 business goal.
A single bad early call was the biggest predictor of cancellation
Cancellation data told a consistent story. A single bad early call was the biggest predictor of cancellation, often before the customer had ever heard one of their own real calls. The pattern was always the same: a customer hits a scheduling bug for about a week, concludes ‘the AI receptionist doesn’t work’, declines a six-months-free retention offer, and asks for a refund.
We were losing meaningful MRR every week to this pattern, and it accounted for a substantial share of paid cancellations.
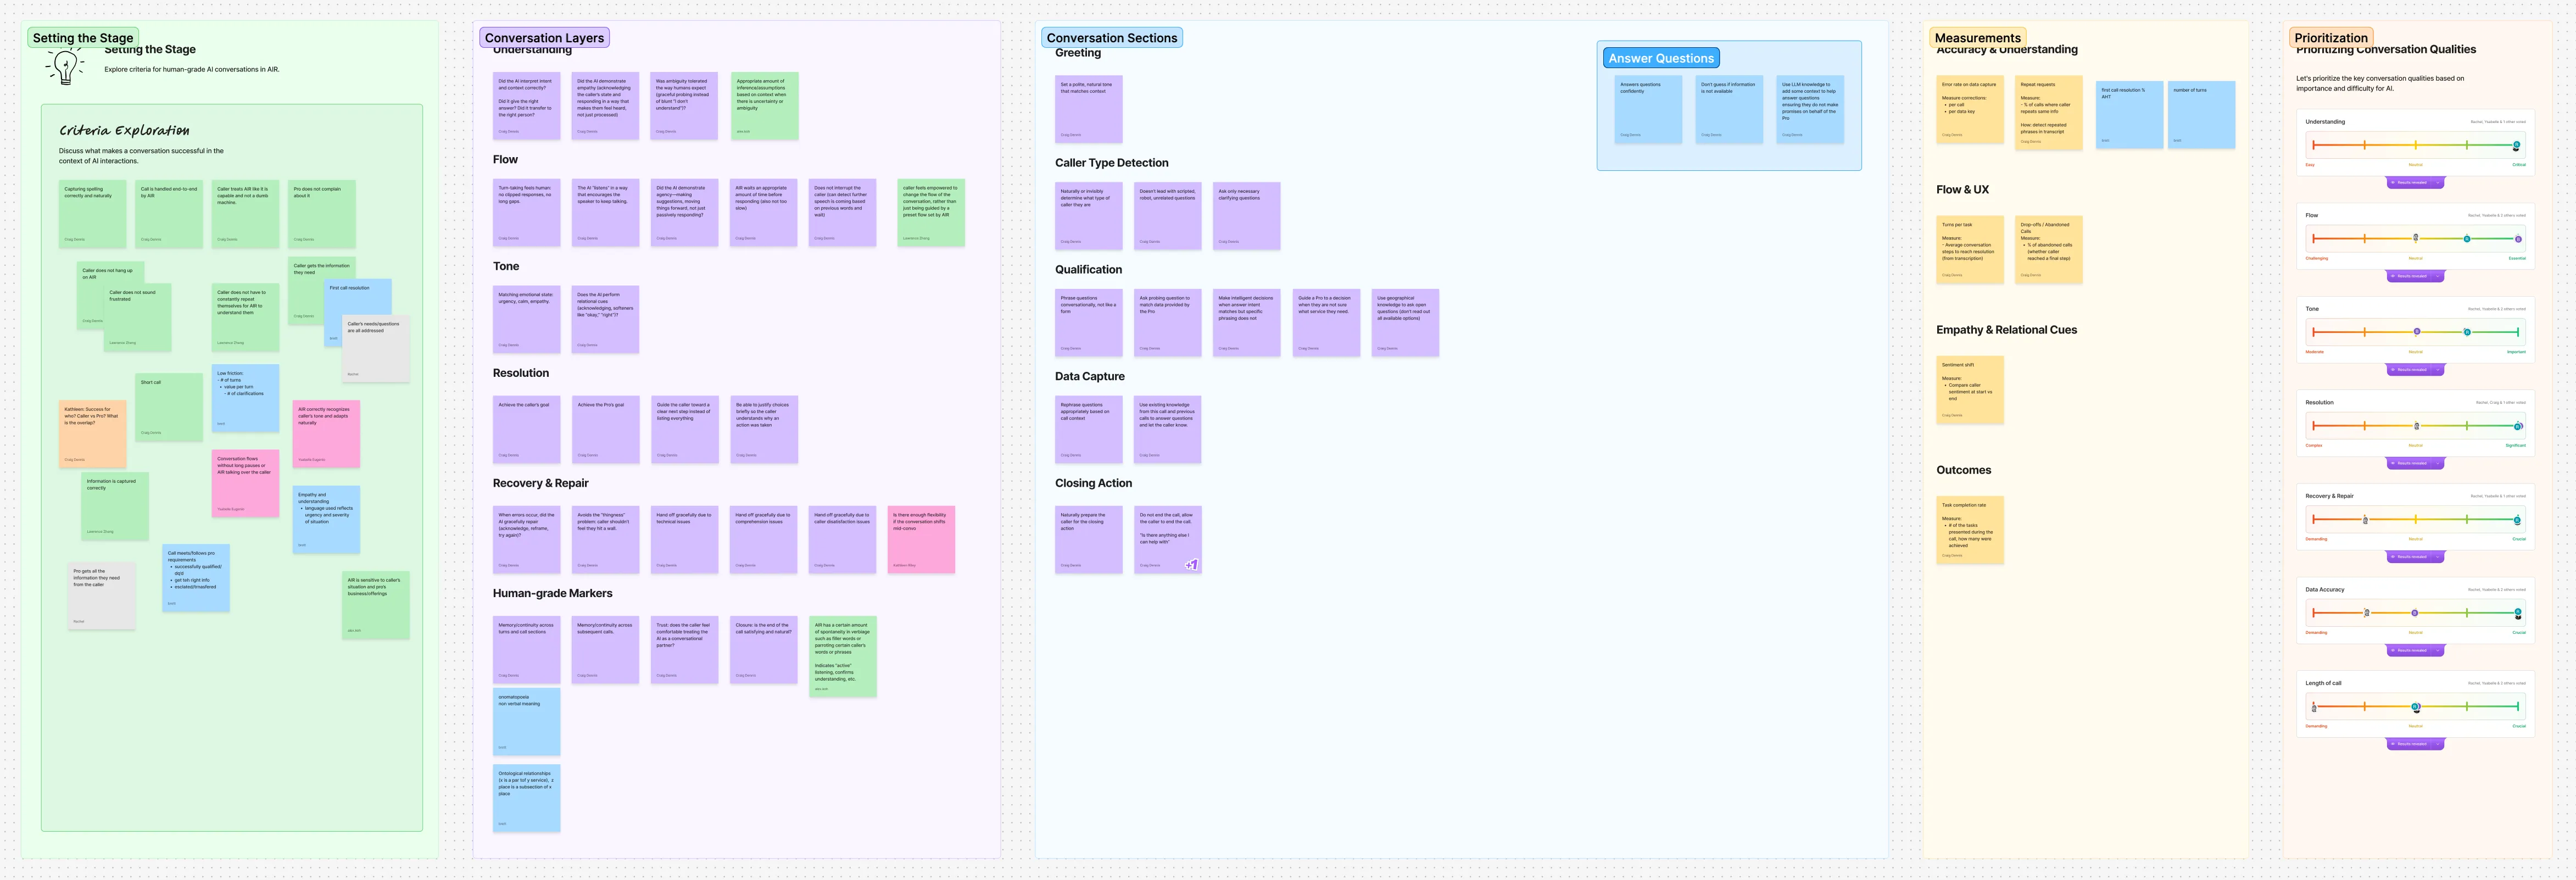
The deeper issue was that the product was opaque. Customers couldn’t tell a temporary issue from a systemic failure, a known bug from something specific to their setup, or a degrading experience from a recovering one. Without that context, they assumed the worst and made permanent decisions about temporary problems. This was a measurement gap, not a support problem, and it was costing us revenue.
The fix had to scale without adding people
Faster fixing, more human touchpoints, and SLA guarantees were all on the table, but each one solved the problem by adding people. We needed a product fix instead.
The aim was a unifying product health metric that addressed early-experience trust at the product level, not the support level. One number the whole company could organise around.
I wrote the thesis and defined what ‘good’ meant
The existing metrics were measuring the wrong thing. They tracked whether data fields were captured or whether callers sounded frustrated, and neither correlated reliably with whether the customer’s objective was actually met. A polite caller could leave with nothing useful; a frustrated caller could get exactly what they needed. The signal was wrong.
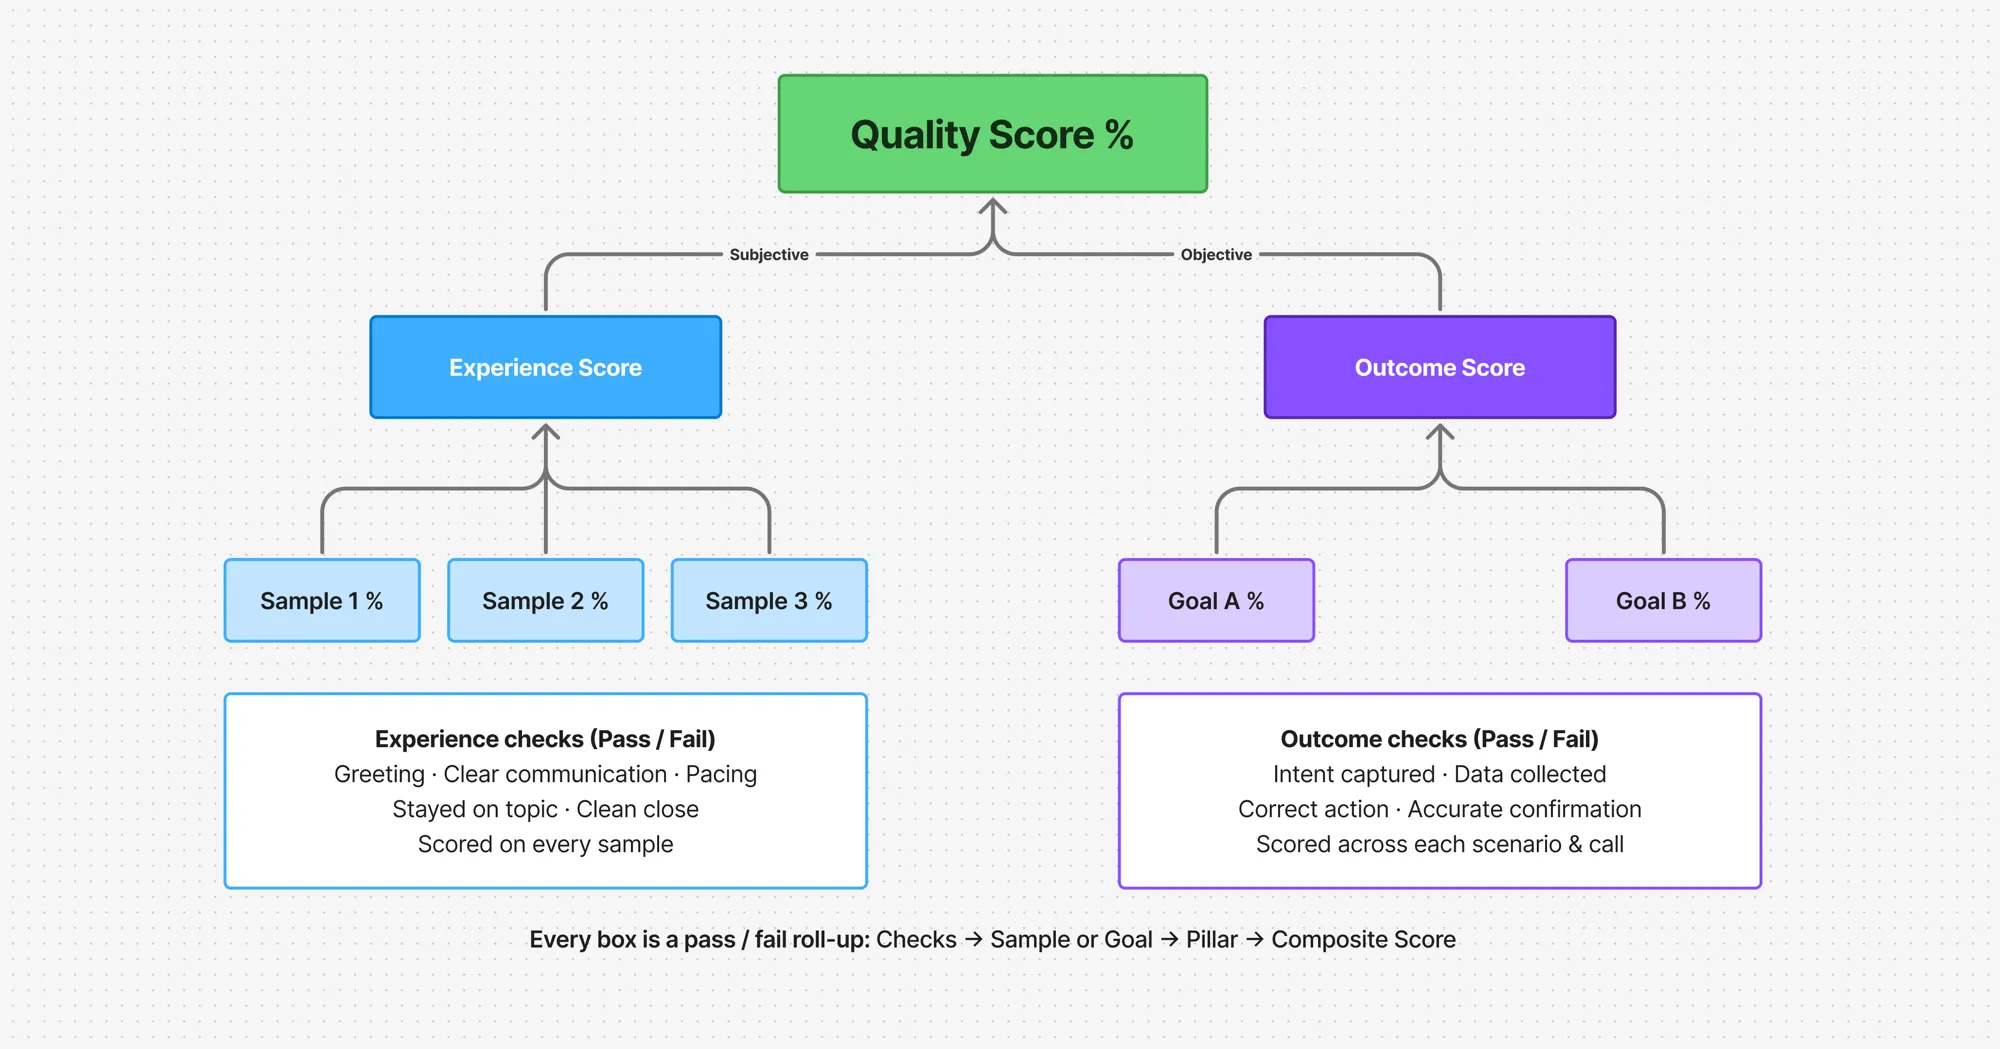
So I wrote the strategy around a diagnostic thesis: we can’t move what we don’t measure. The score is two numbers per call, both derived from transcript analysis using ‘LLM-as-a-judge’:
- Call Experience: does it sound natural? Eight binary checks (no dead air, no repetition, contextual responses, no interruptions, caller-guided, natural opening and closing, appropriate pacing).
- Call Effectiveness: does it achieve the customer’s objective? Five dimensions (caller type classification, qualification correctness, data capture completeness, FAQ accuracy, correct next step).
The score applies per call, rolls up per customer, then per vertical. A 100% Experience score means the transcript is indistinguishable from a human receptionist; a 100% Effectiveness score means every call achieved the customer’s primary objective.
Defining those criteria was the part I owned. Design ran validation against known troublesome accounts where the failures were already documented, and any criteria that didn’t surface a known failure got revised and re-run. The finalised criteria became the specification engineering built the ‘LLM-as-a-judge’ prompts against.
The hard part was proving the score meant anything
Getting the criteria right still left the harder question: did the automated score actually match what a human would say about the call? A score that drifts up and down without tracking what really happened is worse than no score, because people act on it; a 90% on a call that failed the customer would send every decision built on it the wrong way, and take the credibility of the whole metric with it.
So I made validity a launch gate. The method was already proven: a designer on my team had built this kind of baseline for an earlier AI review, scoring a set of real calls by hand against the same criteria to get a human judgement the automated score could be measured against. I set the bar at 85% alignment between the human ratings and the AI’s score before we’d trust it to ship, and the plan to run it for the Quality Score was ready. Calibrating a score against people is what turns it from a plausible-looking number into one you can defend.
The validation method
The calibration followed a golden-set method a designer on my team had already run on an earlier AI review. Sample around 100 real calls across five high-volume accounts, spanning verticals, call lengths, and failure modes; have people grade each against the same yes/no criteria to form the ground truth; then compare the automated score against those human grades. The gate was 85% alignment before launch, re-checked quarterly. The plan was ready when I left; the Quality Score’s own run had not yet started.
Roles were clear. I owned the strategy, the scoring criteria, and the 85% bar. A designer on my team owned the human-scoring method, already proven on the earlier review. Engineering built the ‘LLM-as-a-judge’ prompts from the criteria I finalised.
Getting it adopted was a separate job from getting it right
I put the strategy doc out as a draft, it came back with six revision notes, and I sent it back with each note addressed visibly and numbered so the reviewer could confirm every one was handled. Manager sign-off came in writing before anything went wider. Then I sequenced the audience: the design team first, to surface misalignment before it went public, then the leadership team in their own channel with a Loom walkthrough framing the four guiding principles and three strategic bets. A Loom lets a busy exec react in their own time and leaves an artifact they can re-share.
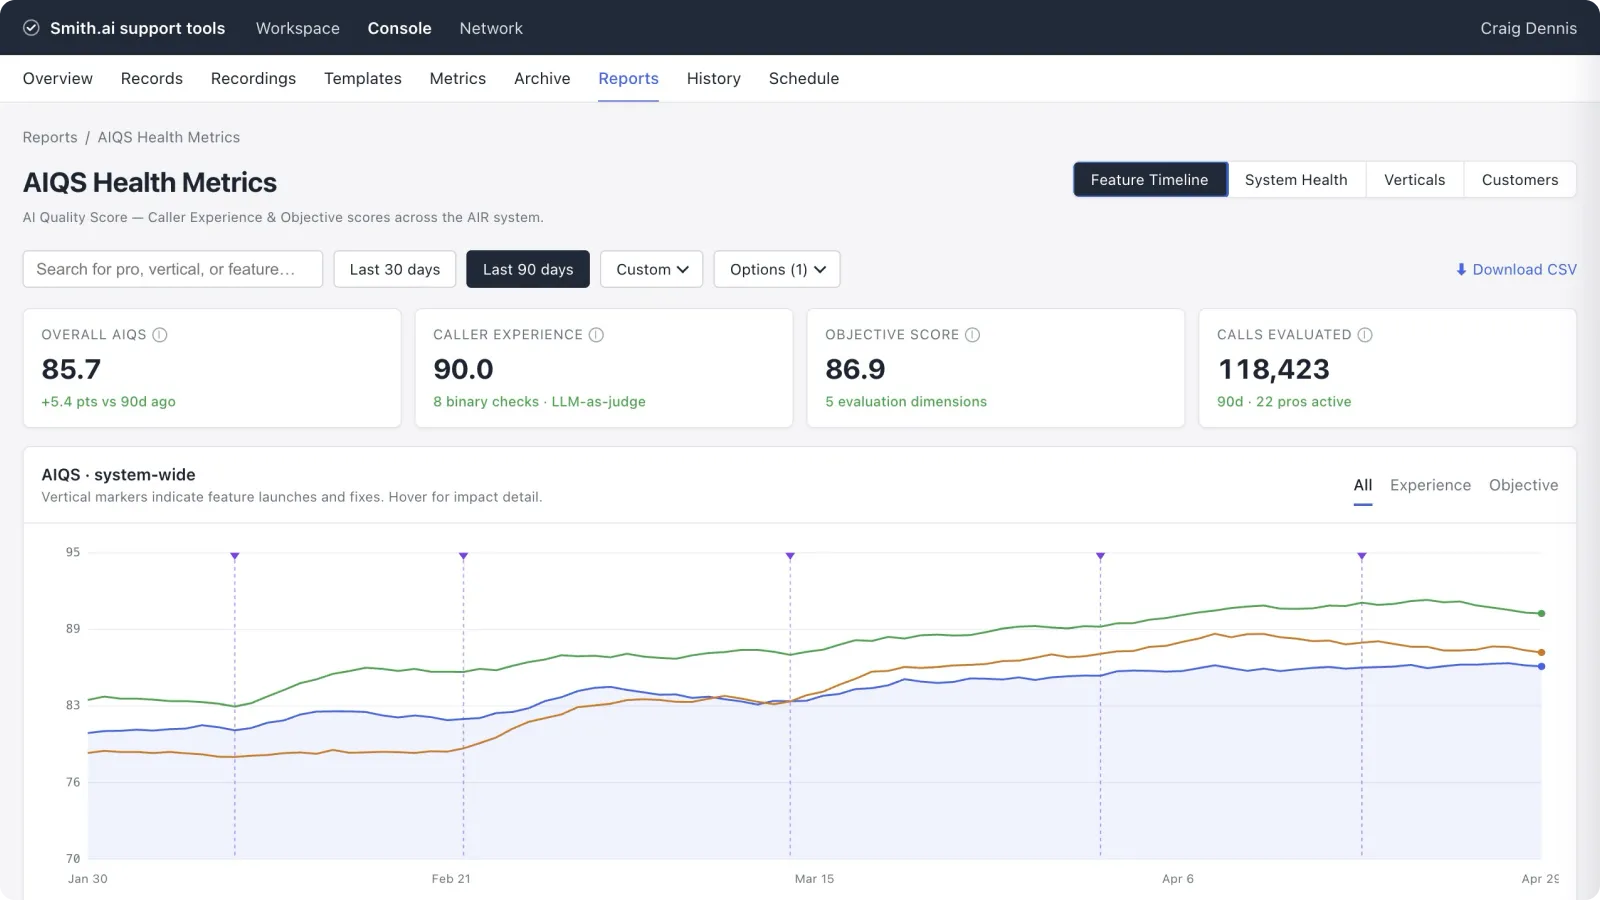
To make the score concrete, I used Lovable to prototype what the dashboard could look like. That moved it out of conceptual territory and into something stakeholders could react to; two-thirds of the exec team commented on details they would previously have skipped.
I framed the score to the C-suite as enabling three things at once: proactive retention conversations (‘your score dropped to 72% last week due to a known bug, it’s now fixed and back to 95%’), product intelligence (which features correlate with high scores, which issues cause the steepest drops), and a market differentiator (publishing how scores are derived in a category where competitors rely on black-box metrics). To keep the strategy alive after the first round of buy-in, I held a monthly OKR update on a fixed schedule, three months running, each one referencing the strategic bets explicitly.
The strategy moved from draft to leadership presentation fast. Six revision notes addressed the same week, manager approval, a team-facing share, then a leadership presentation with a PDF and a Loom video framing Q2 context for existing projects and product trajectory.
Sign-off came at multiple levels, and not without pushback. A senior VP responded to the draft with ‘…this is perfect. Everything about it… What do I need to do to get it all live?’ An engineering lead in the same review was less convinced: ‘I still don’t see how [missing context] gets us to the number.’ The OKRs supporting the strategy came back from my manager as ‘1000% better’ after the revision pass. The combination of explicit sign-off, visible iteration, and addressing that pushback in the open is what converted the doc from a proposal into the strategy the leadership team uses as Q2 framing.
Adopted, then handed off
It became core to Product Design’s 2026 strategy. The three strategic bets all hang off the score: AI Score + transparency for retention, vertical-specific configurations for the legal market, design system + AI as a force multiplier.
The strategy also gave each function a role in the score: CS would use score drops as a proactive intervention trigger, Marketing would reference transparent scoring as a differentiator, Sales would pitch verticals with scores behind them, and Product and Design would get a repeatable framework for new verticals.
I was laid off before the score’s own calibration began. The plan to run it was ready, and the score was folded into a separate project already shipping in beta; nothing was live on the Health Metrics view when I left. It moved forward as a retention story the business could sell, before it had been proven as a metric. Closing that gap, between a score people can sell and a score people can trust, is the part I would have taken next.