
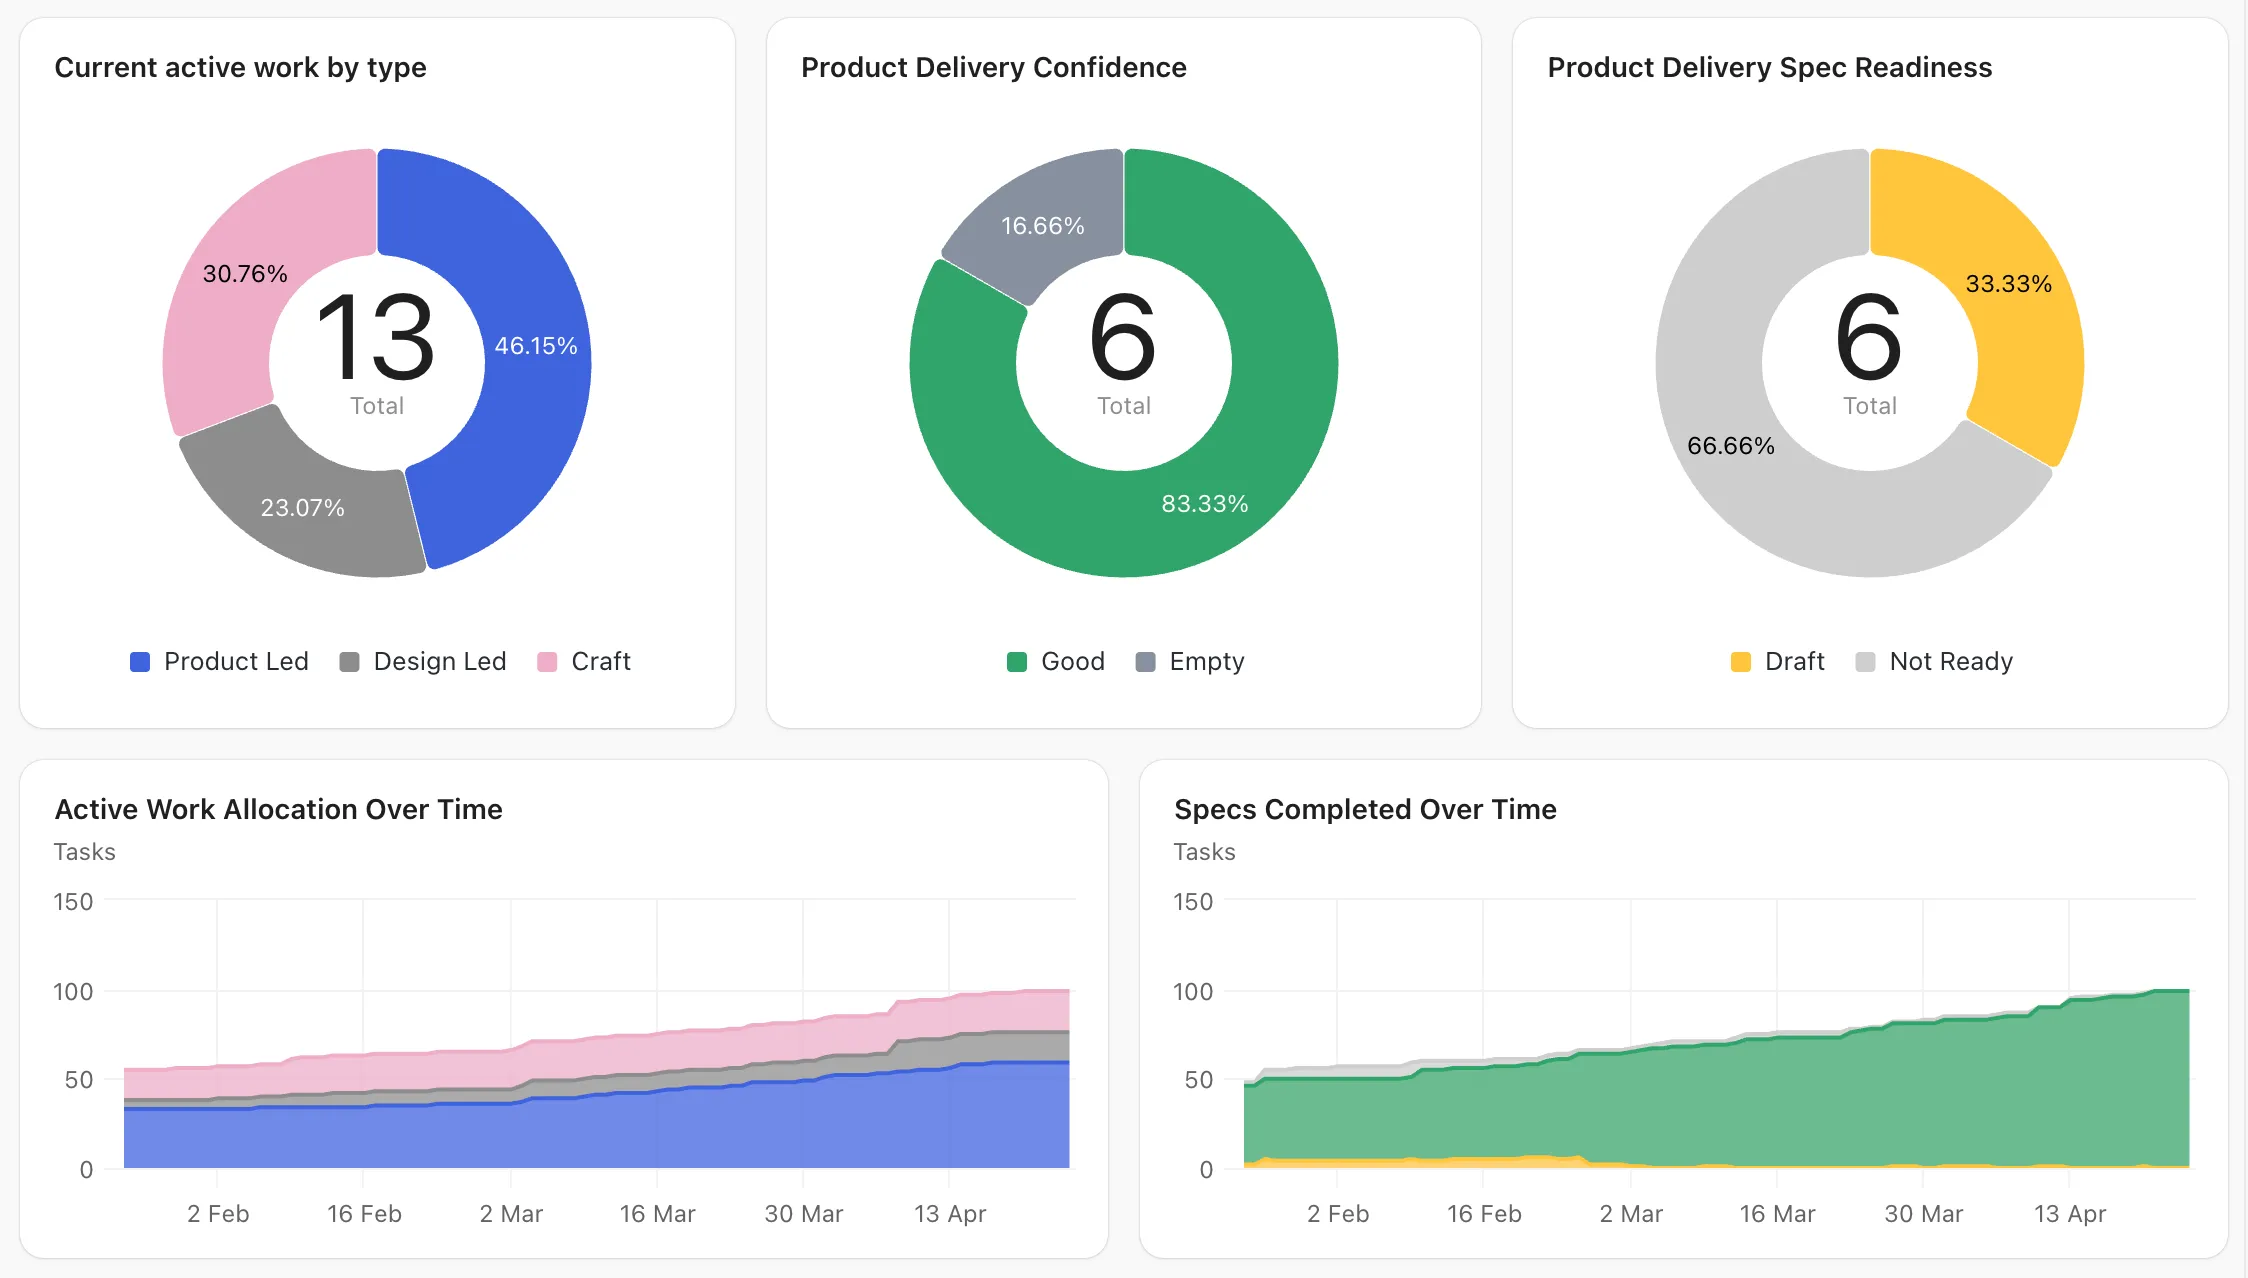
Last month I wanted a specific view of my team’s work in ClickUp, and the built-in dashboards couldn’t give it to me. So I did the thing I keep ending up doing: I built the dashboard in Claude Code instead, first from a CSV export and later by pulling the data across through ClickUp’s MCP. The data was all there. I just couldn’t assemble it into the view I needed inside the tool that already owned it.
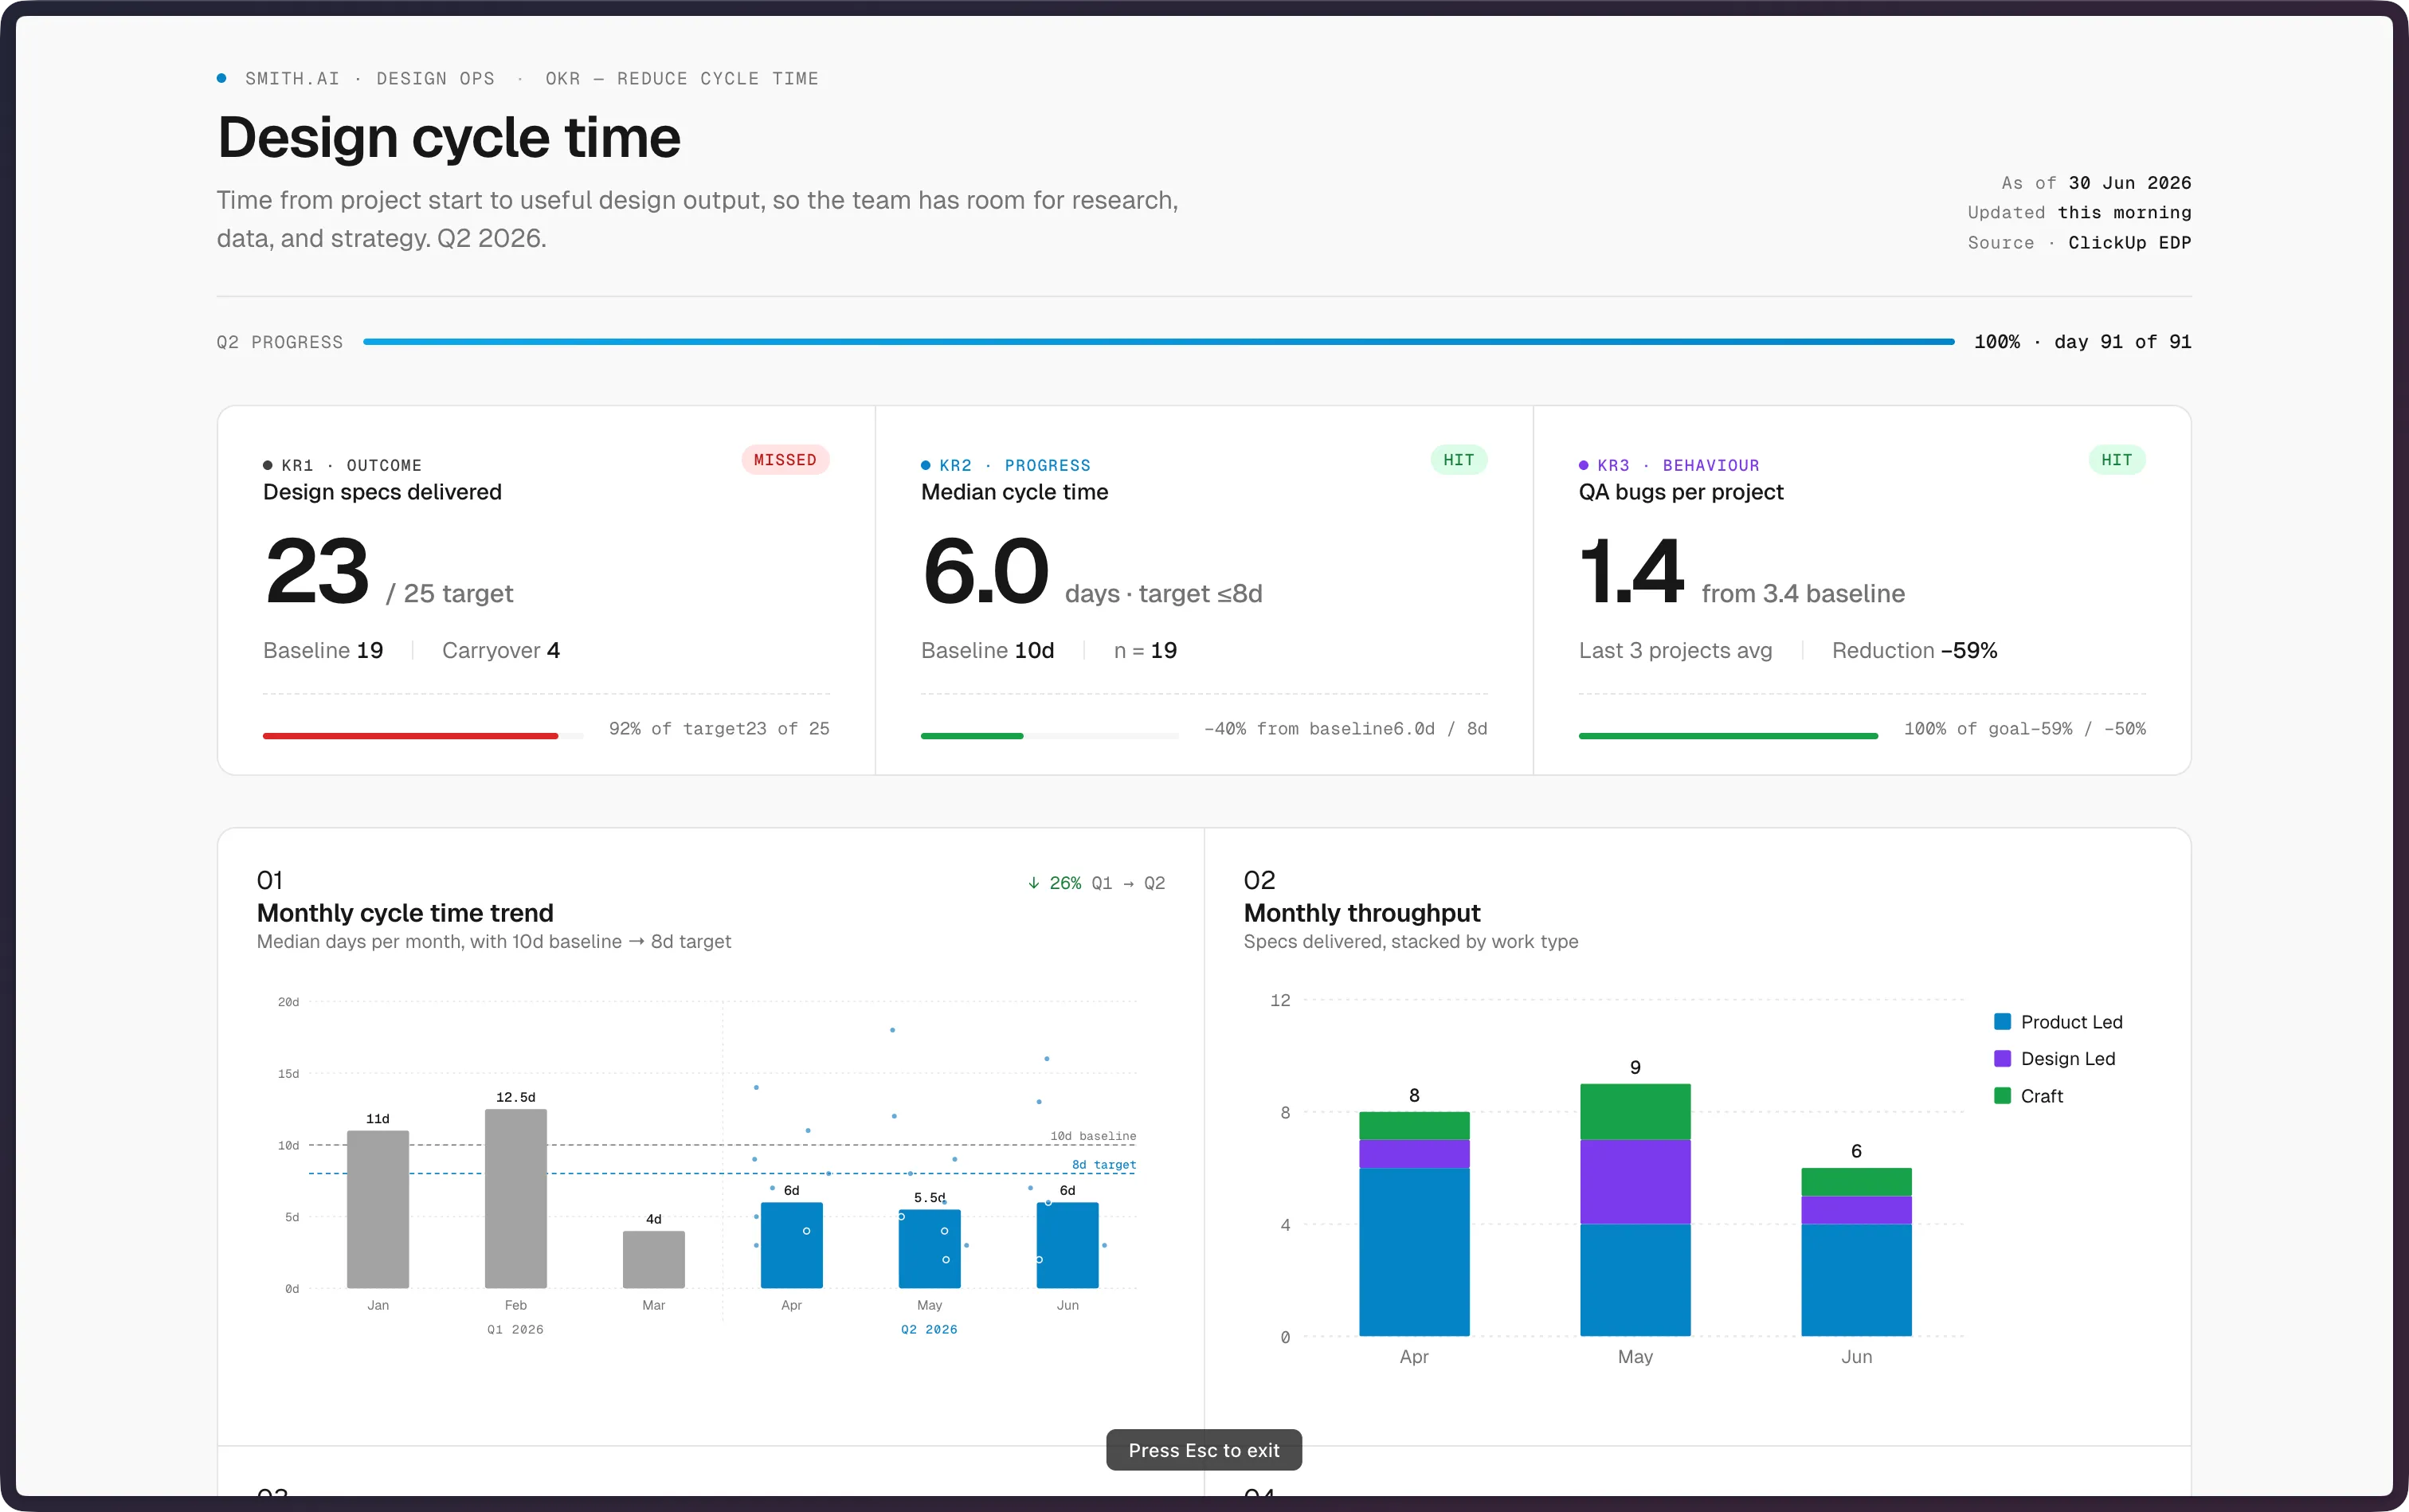
That’s the gap. The interface you’re looking at in most software was designed for someone else, months before you needed it.
Every dashboard is a guess at what you need
Most SaaS ships with a fixed set of widgets and filtering research suggested you’d want. If the view you actually need isn’t in there, you can choose from the predefined ones, file a ticket and wait for a roadmap slot, or export to a spreadsheet and build the thing yourself, badly, every week. The interface was designed once, for everyone, and it has to serve you forever after that. That gap between what’s on screen and what you’re actually trying to decide is the whole problem.
Describe what you want and the interface builds itself
That’s the premise I keep coming back to. You describe what you want in plain language, show me churn by account tier for the last two quarters, ignore anything under $500 MRR, and the system lays it out in whatever way it thinks is meaningful. Then it asks you a question, not to be thorough, but because it genuinely doesn’t know yet what you’re trying to decide. You keep iterating, swap that bar chart for a table, break it out by region, cut the noise, until what’s on screen matches this week’s question instead of a guess a product team made six months ago. The dashboard stops being a decision someone made for you and turns into something closer to a conversation.
Generated interfaces still need a design system underneath them
Without shared rules, a generated interface looks different every time you ask for something: different typography, different colour choices, buttons that behave one way here and another way there. People don’t trust something that looks freshly built on every use; consistency is what signals the system actually knows what it’s doing. A design system is a promise about how an interface behaves, and a generative interface has no way to keep that promise on its own.
A design system for generated interfaces has to do more than define components
Most design systems today are a component library and a token set: buttons, a colour ramp, a spacing scale. That’s not enough once the system is generating a chart type that didn’t exist yesterday, because it’s the only thing that actually answers your specific question. The system needs rules as well as parts: when it’s allowed to create something new versus when it has to reuse what already exists, what data density is acceptable, which interactions stay consistent across every surface, what accessibility a generated element has to satisfy before it’s allowed to render. The library used to be the whole design system. In a generative one, it only covers the known parts; the harder half is the rules for what’s allowed to be invented.
MCPs hand you raw materials, and maintaining them becomes your job
Right now every SaaS product is racing to ship an MCP so tools like Claude and ChatGPT can connect to its data and build whatever you ask for. That’s useful, and I think it’s also a transitional phase rather than the destination. A one-off is great; I built one to compare two things for a presentation and it did exactly the job. The trouble starts the second time you need it, when the data has moved on and you have to re-run the whole thing. The moment you build something real on top of someone else’s data through a general-purpose AI tool, you’ve quietly become the maintainer of a small piece of software: its bugs, its data refresh, who’s allowed to see it, whether it still works next month. Connecting your data to a general AI tool hands you a result, and quietly, a maintenance obligation most people never signed up for.
And then you have to share it
Say the dashboard is right. Now I want my team to see it. How? I screenshot it into Slack, or I send them the HTML file and hope it opens on their machine. Either way I’ve swapped the live data for a snapshot that’s already going stale. SaaS solved sharing decades ago: a link, permissions, and a view that’s current every time someone opens it. Building the view outside the platform throws all of that away, and hands it back to me to rebuild by hand.
Platforms absorb the generative loop back
That’s where I think this swings back. The companies sitting on the data can absorb that maintenance cost at a scale an individual never can, and the same loop, describe what you want, get a layout, iterate on it, moves inside the platform instead of staying external to it. Inside the platform it goes further than assembling from a fixed set of templates: new components get generated on the fly, inside whatever constraints the design system enforces, to do exactly what you asked. You still get the granular, personal interface. You just get it with authentication, sharing, and data that stays live, without ever running anything yourself.
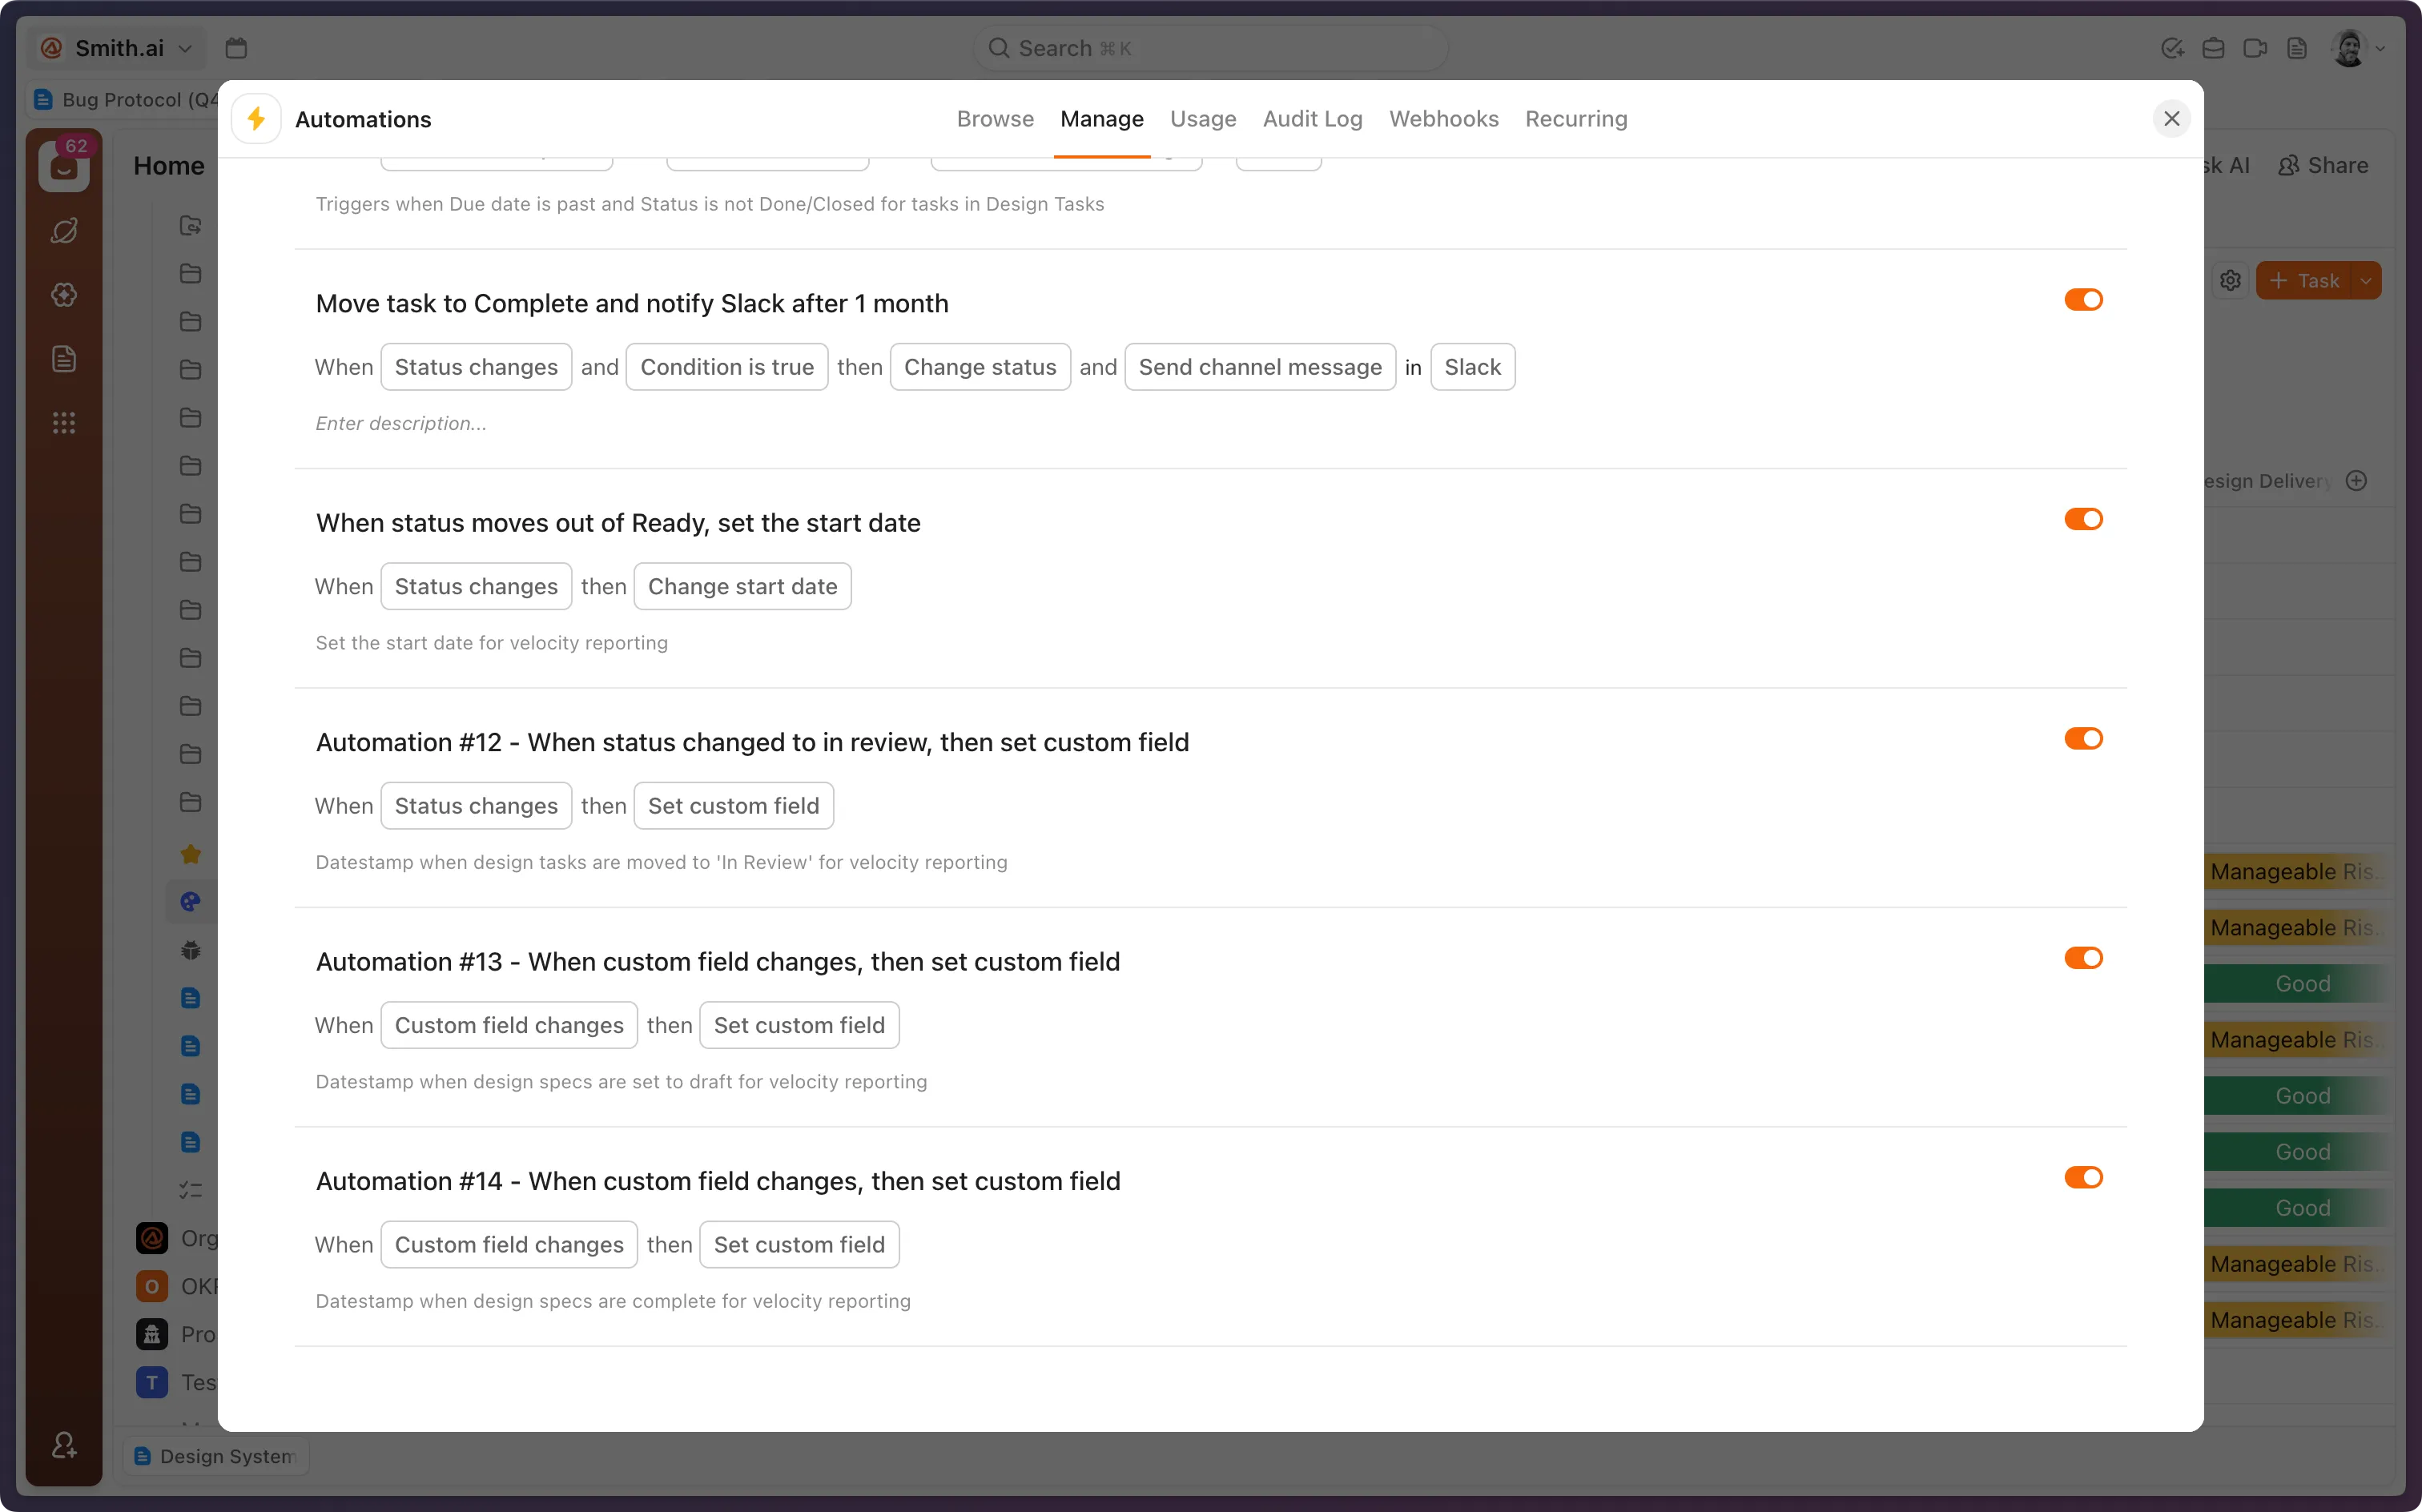
ClickUp is a good example of a platform that’s almost there. It already holds the data I wanted, and it’s already shipping agents; the one thing I couldn’t do was turn that data into my view without leaving the tool. Whoever closes that gap turns the workaround I did in Claude Code into a feature, and the whole list of problems that came with doing it myself goes away with it: no permissions to wire up, no command to remember to run, no stale file sitting in a folder.
Data is the ‘moat’ now, and it always was. What’s changing is the second half of that sentence: it isn’t just about holding the data anymore, it’s about being the only one who can turn it into a trustworthy interface the moment you ask for one.
Dashboards first, then the workflows
Reports and dashboards are where this lands first; they only read the data, so they’re the safe place to start. After that it goes further than looking: generating the interface for a workflow, not just a view of it, so you change the data and move the work through the same tool you’d ask a chart of. Reports first, because they only read. Then the interfaces that change it.